
Every basho, I create a few charts that track the popularity of the basho on Reddit.com/r/sumo, as measured by the number of daily discussion thread comments, unique visitors to the subreddit, and page views of the subreddit. Below are five charts that illustrate the popularity of the Nagoya Basho 2019 relative to the prior basho.
The first chart illustrates the number of comments on each daily post, and it includes the prior four basho. As seen, many days had the fewest number of comments since I’ve been tracking these statistics, with Day 7 being the fewest amount of comments ever. At the same time, Day 10 had the most number of comments ever on a Day 10, which was partially due to the retirement of Aminishiki. The end of an era!
Click here for a full sized version of the chart below!

Note: The two * indicate that another post in addition to the daily post was included in the comment count, as a separate post discussing the daily events gathered a significant number of comments. On Day 10, the separate post was a discussion of Aminishiki’s retirement. On Day 11, the separate post was a discussion of Takayasu withdrawing. I included popular posts about specific events in the comment count of prior basho, such as Kisensoto retiring, so this does not bias the observations.
The second chart illustrates the number of daily page views and unique visitors between 2/2/2019 and 7/27/2019. Interesting to see that, although many days did not prompt much discussion, people still tuned into Reddit.com/r/sumo. I don’t think anything will top the Tochinoshin controversy in the Natsu basho, though!
Click here for a full sized version of the chart below!
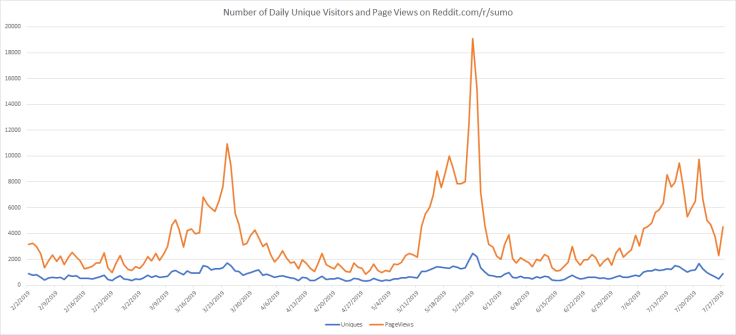
The third chart illustrates the number of daily unique visitors between 2/2/2019 and 7/27/2019. This gives a clearer view of the blue line in the prior chart.
Click here for a full sized version of the chart below!

The fourth chart illustrates the number of monthly page views and unique visitors between 4/2018 and 7/2019; however, there are still four days left in July. So, the number of page views and unique visitors will increase slightly more.
Click here for a full sized version of the chart below!
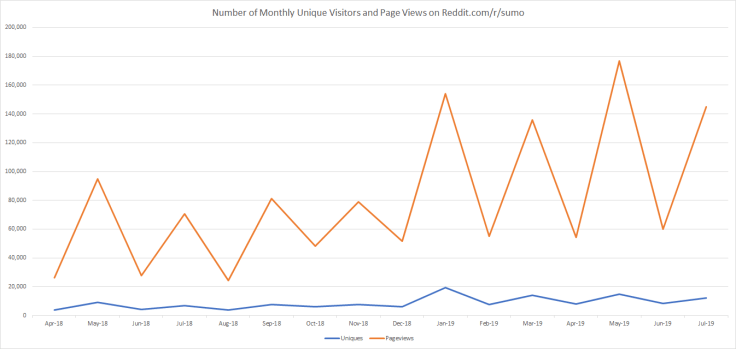
The fifth chart illustrates the number of monthly unique visitors between 4/2018 and 5/2019. Again, there are still four days left in July, so the number of page views and unique visitors will increase slightly more.
Click here for a full sized version of the chart below!

If you have any comments or questions about this post, feel free to email me at NorthAmericanSumo@Gmail.com. Thanks for reading!

Leave a comment