
Every basho, I create a few charts that track the popularity of the basho on Reddit.com/r/sumo, as measured by the number of daily discussion thread comments, unique visitors to the subreddit, and page views of the subreddit. Below are five charts that illustrate the popularity of the Aki Basho 2019 relative to the prior basho.
The first chart illustrates the number of comments on each daily post, and it includes the prior five basho. We now have one full year of basho in one chart! The Aki basho was on the slightly above average side for daily comments. At the same time, there wasn’t a single day that drew a lot of attention. Of course, the finale of the Natsu Basho 2019 remains the most discussed day on Reddit.com/r/sumo.
Click here for a full sized version of the chart below!
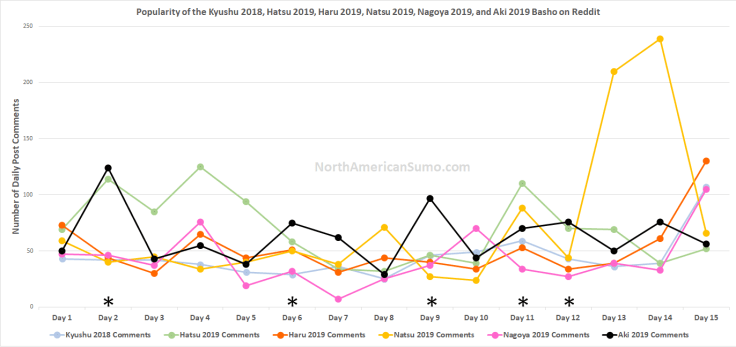
Note: The five * indicate that another post in addition to the daily post was included in the comment count, as a separate post discussing the daily events gathered a significant number of comments. These posts are below.
https://old.reddit.com/r/Sumo/comments/d1wzdy/i_am_really_sick_and_tired_of_how_injuries_are/
https://old.reddit.com/r/Sumo/comments/d3naxt/_/
https://old.reddit.com/r/Sumo/comments/d5430s/who_wins_the_yusho_predictions/
https://old.reddit.com/r/Sumo/comments/d6fvni/mitakeumi_ozeki_promotion/
https://old.reddit.com/r/Sumo/comments/d67h69/are_enho_ishiura_gonna_face_one_another_id_love/
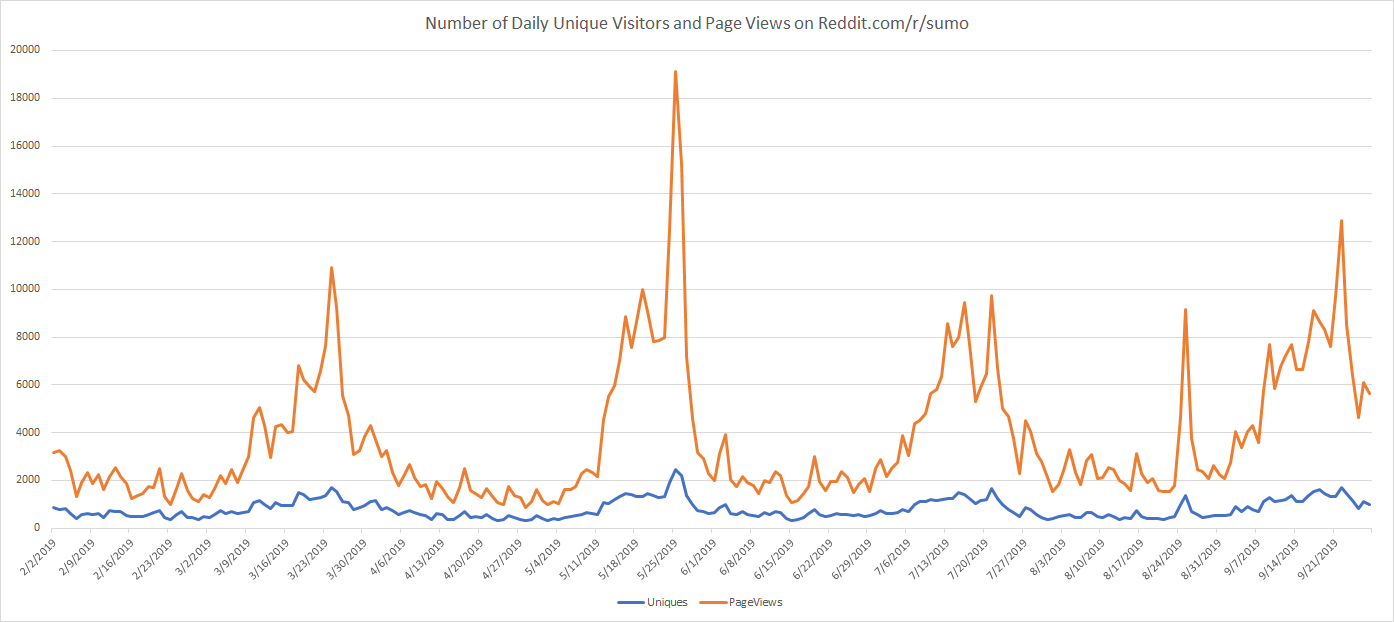
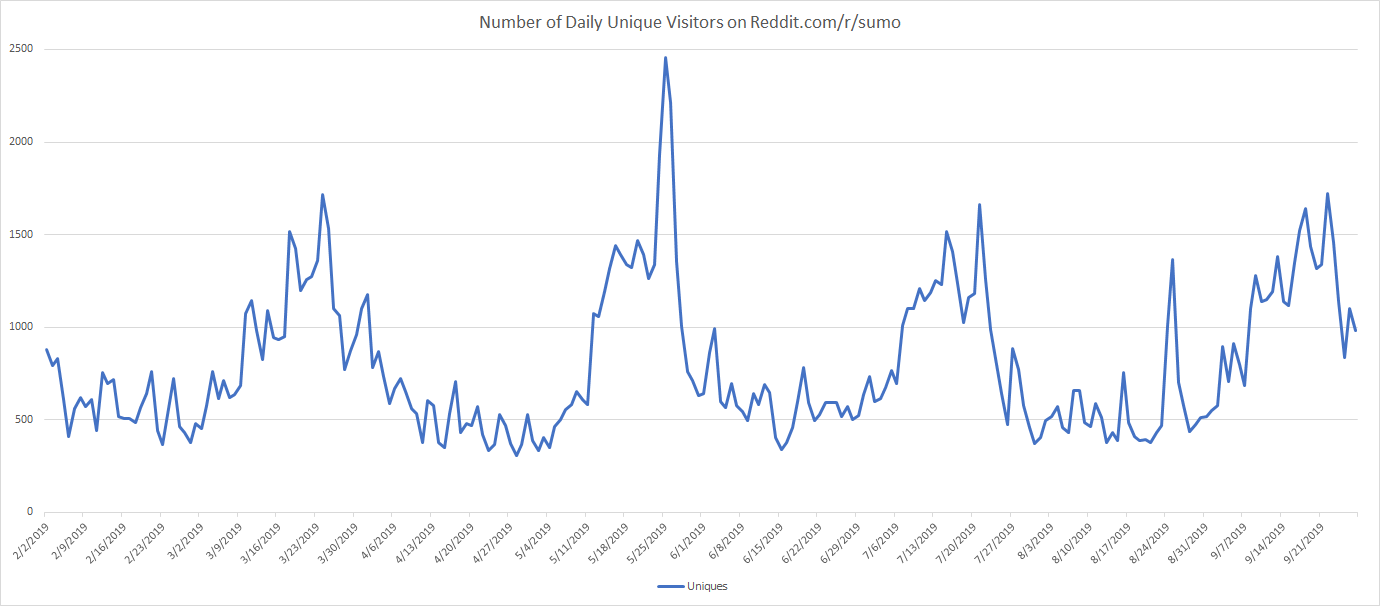
The second chart illustrates the number of daily page views and unique visitors between 2/2/2019 and 9/27/2019. This basho included the second-most viewed day since I’ve been recording this data, as estimated by pageviews. Also, the huge bump before the basho was attention drawn to the subreddit due to Kakuryu making a three-pointer before a basketball game.
Click here for a full sized version of the chart below!

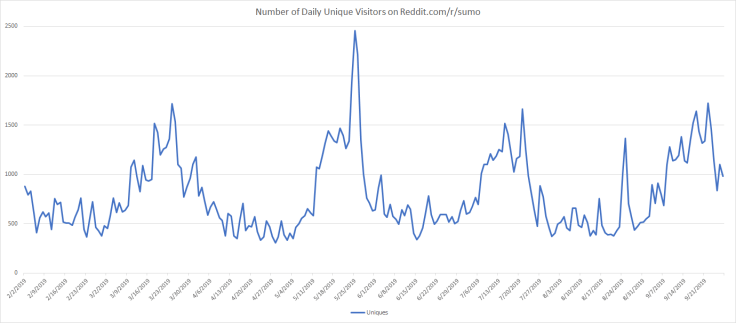
The third chart illustrates the number of daily unique visitors between 2/2/2019 and 9/27/2019. This gives a clearer view of the blue line in the prior chart.
Click here for a full sized version of the chart below!
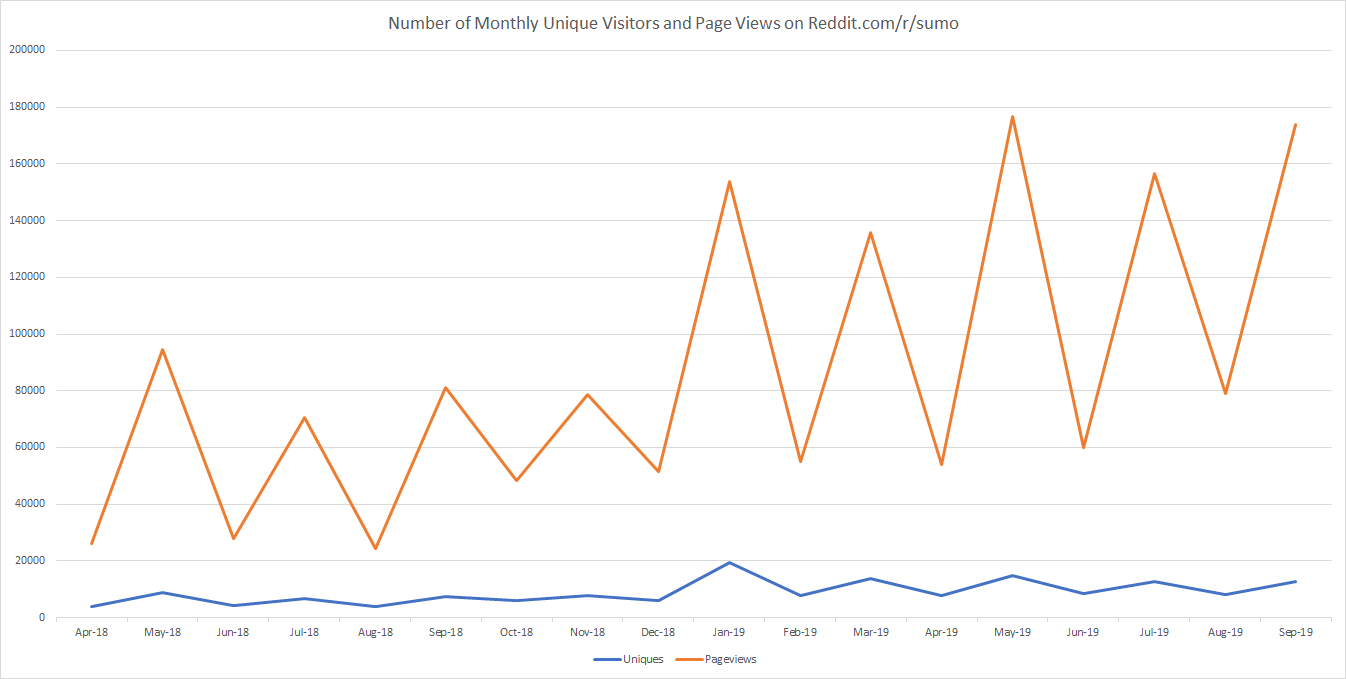
The fourth chart illustrates the number of monthly page views and unique visitors between 4/2018 and 9/2019; however, there are still three days left in July. So, the number of page views and unique visitors will increase slightly more. We may have our most-viewed month ever!
Click here for a full sized version of the chart below!
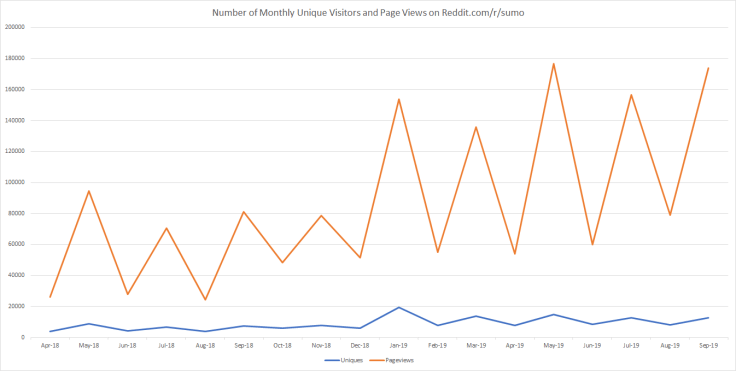
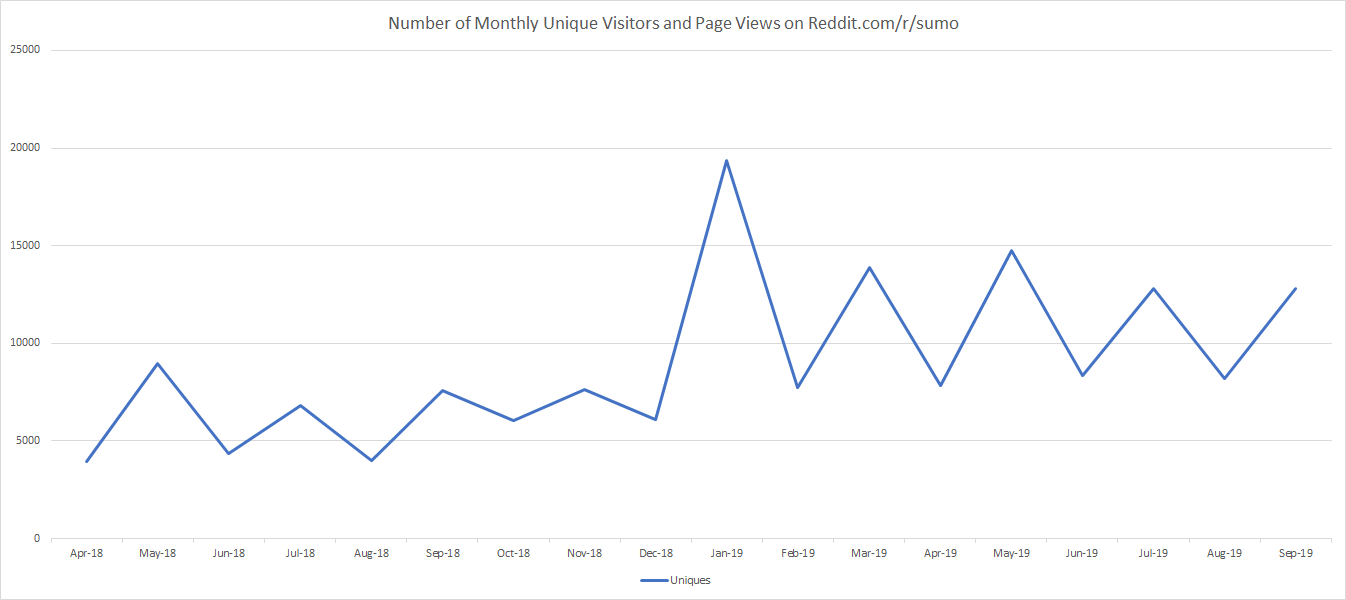
The fifth chart illustrates the number of monthly unique visitors between 4/2018 and 9/2019. Again, there are still four days left in July, so the number of page views and unique visitors will increase slightly more.
Click here for a full sized version of the chart below!

If you have any comments or questions about this post, feel free to email me at NorthAmericanSumo@Gmail.com. Thanks for reading!

Leave a comment